In the design of modern aircraft, computational fluid dynamics (CFD) is a key tool for predicting aerodynamic performance. The reliability of any simulation, however, is fundamentally tied to its accuracy. For aerospace applications, rigorous CFD solutions for aerospace engineering validation against high-fidelity experimental data is a critical step. This is especially true in the transonic flight regime, where flow physics become complex with the formation of shockwaves, severe pressure gradients, and potential for flow separation.
This article presents a validation study of HELYX for a classic aerospace benchmark: transonic flow over the RAE2822 aerofoil. By comparing simulation results against experimental data, this study assesses the performance of HELYX for this type of high-speed, compressible flow simulation.
Benchmark Case: RAE2822 Aerofoil vs. pETW Experimental Data
The RAE2822 is a supercritical aerofoil widely used in the CFD community as a standard validation case for external aerodynamics. Its behaviour in the transonic regime is well-documented, providing a robust benchmark for assessing the accuracy of numerical solvers.
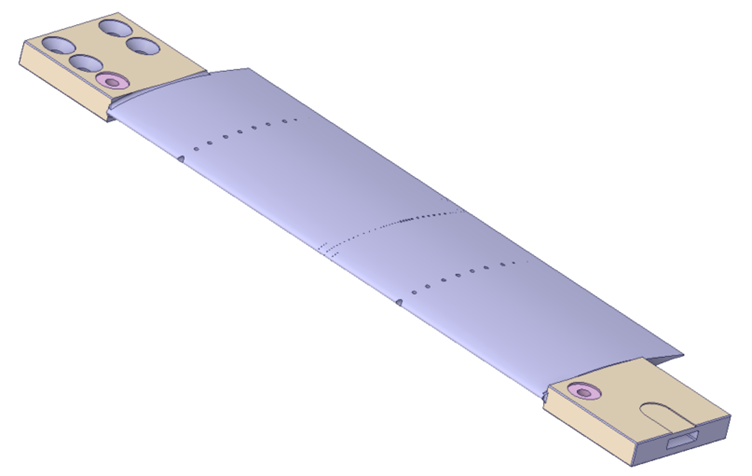
The reference for this study is experimental data from a wind tunnel campaign conducted at the European Transonic Wind Tunnel pilot facility (pETW) as part of an Airbus investigation of the RAE2822 aerofoil 1 . The pETW is a high-fidelity environment capable of replicating flight conditions with Mach numbers up to 1.3.
For this validation, we compared HELYX simulation results for the pressure coefficient distribution over the aerofoil chord against experimental data for two distinct flight conditions:
- Mach 0.6 at angles of attack (α) of 0° and 5°.
- Mach 0.78 at angles of attack (α) of 0° and 3.35°.
Simulation Methodology in HELYX
A successful CFD simulation relies on a meticulous setup, from the computational domain and mesh generation to the selection of appropriate physical models and solver settings.
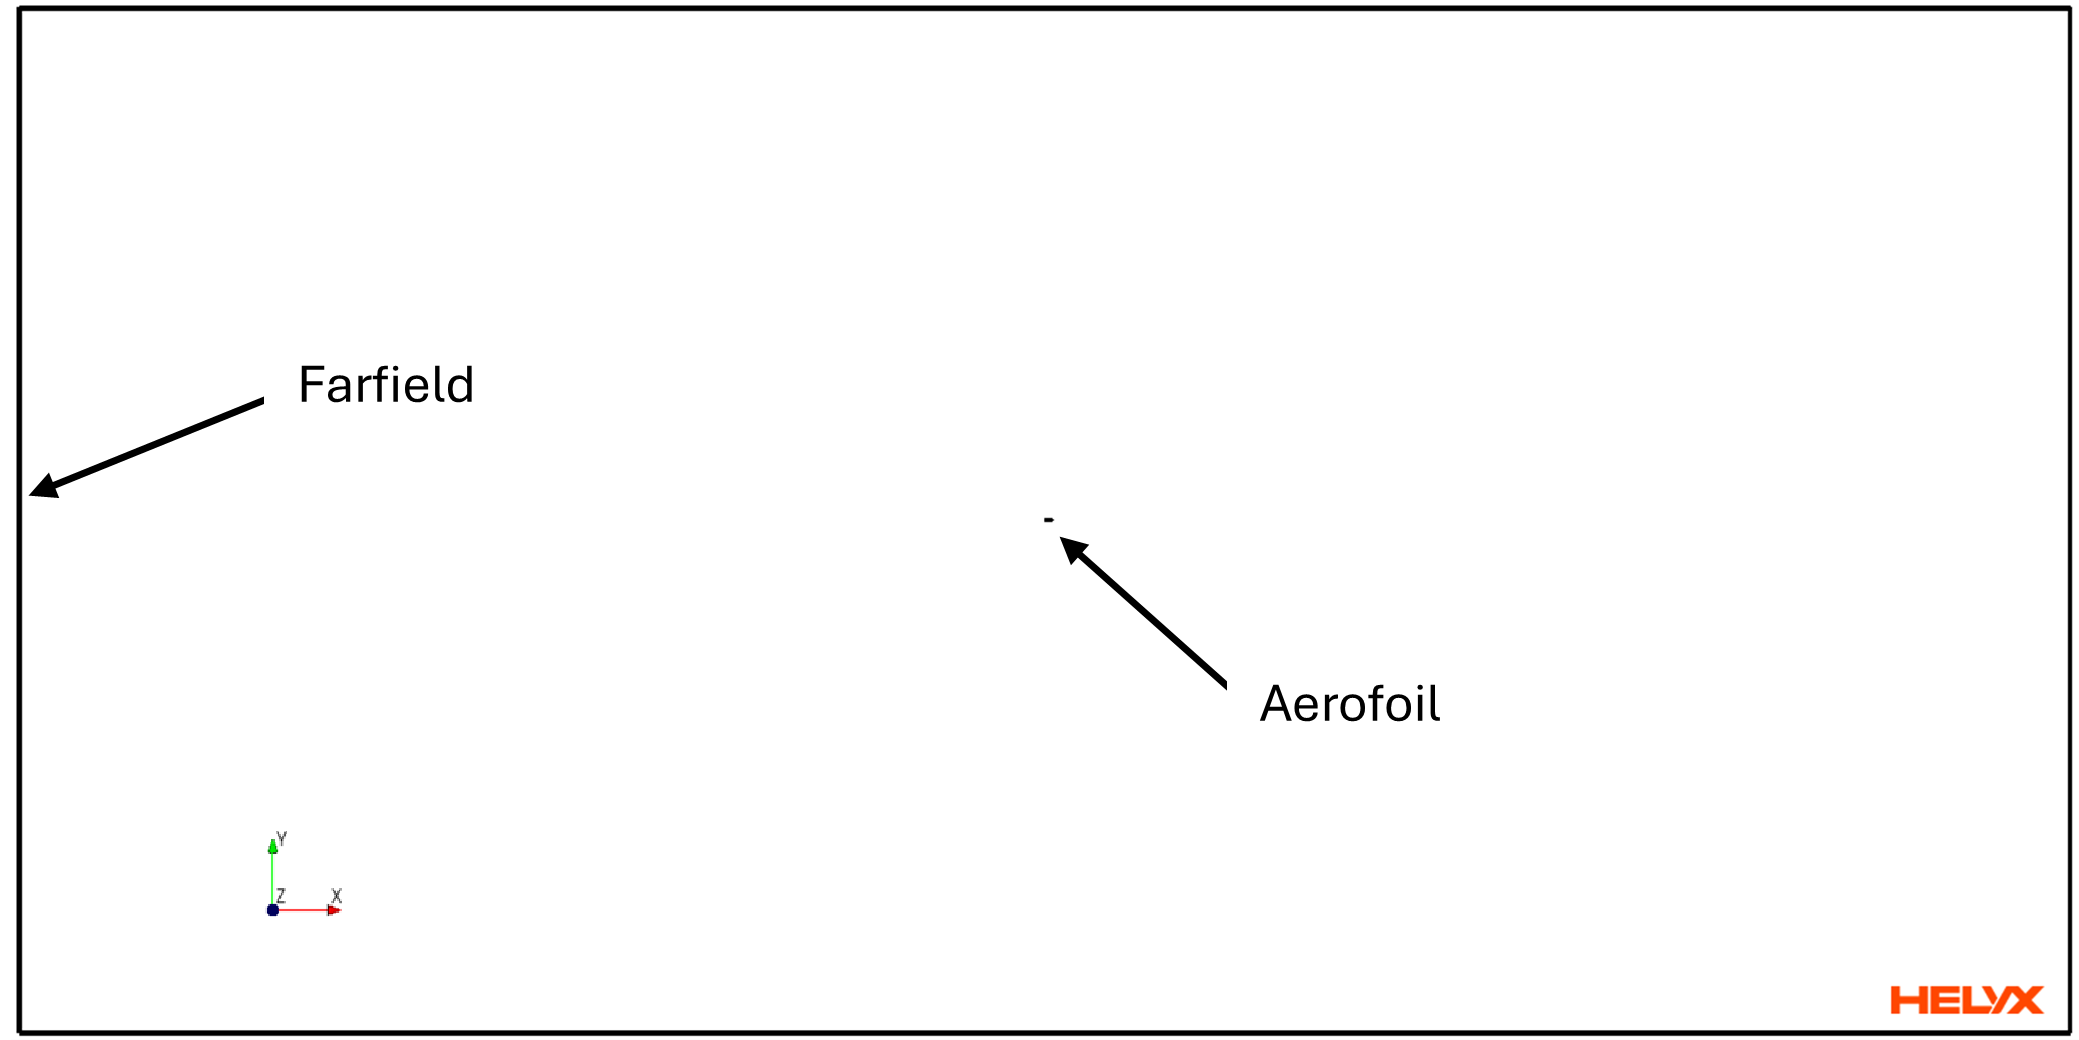
The 2D computational domain was designed to minimize the influence of far-field boundaries on the aerofoil, with the origin placed at the leading edge.
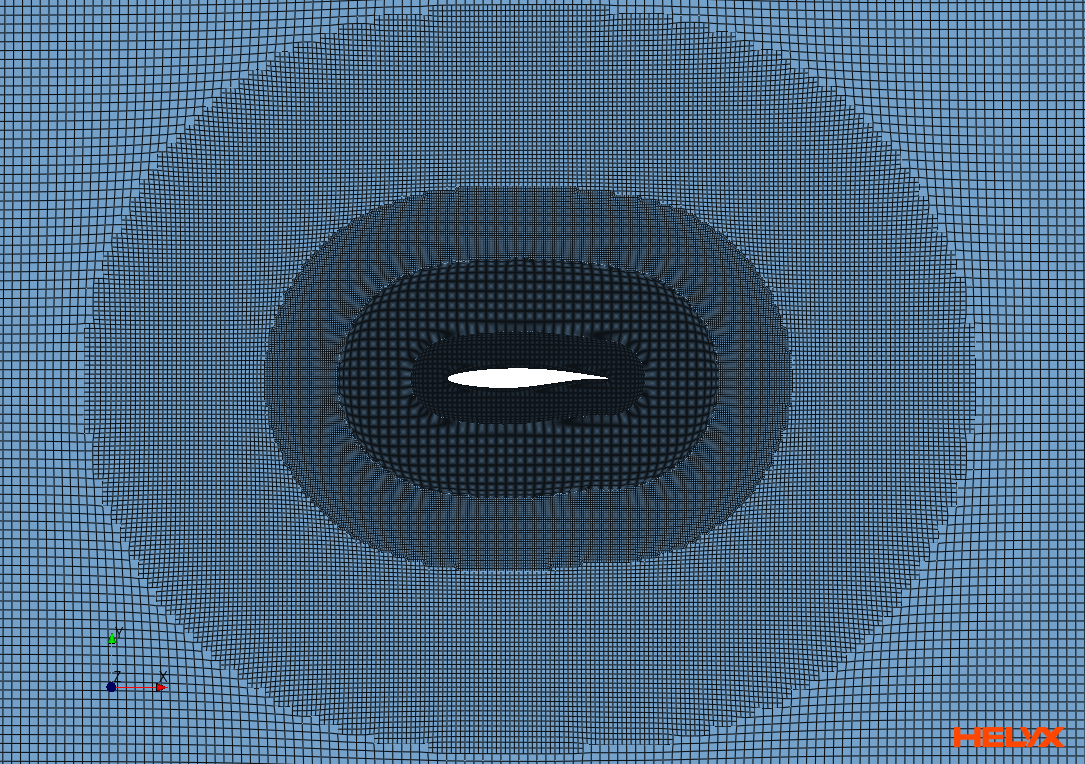
Meshing Strategy: High-Fidelity Resolution with helyxHexMesh
To accurately capture the thin boundary layer and the sharp pressure gradients associated with shockwaves, a high-quality computational mesh is essential. The mesh for this study was generated using helyxHexMesh, employing the extrude algorithm to create a 2D mesh from a 3D symmetry plane.
Key features of the meshing strategy include:
- Targeted Refinement: Volume refinement zones were defined based on distance from the aerofoil to increase cell density in critical flow regions.
- Boundary Layer Resolution: Inflation layers were carefully constructed to resolve the viscous sublayer. A first cell height of 0.0005 mm was used to ensure a wall y⁺ value of approximately 1, a critical requirement for accurate wall shear stress and boundary layer prediction.
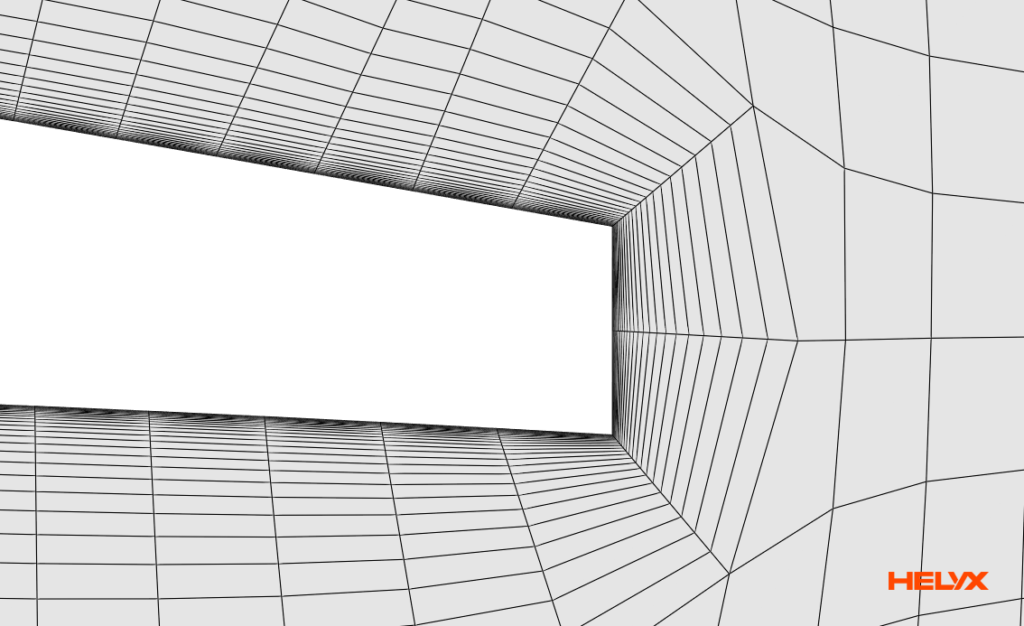
- Efficient Cell Count: The final mesh consisted of 0.90 million cells, balancing computational cost with the need for high-fidelity resolution.
This approach illustrates the use of helyxHexMesh to generate a refined computational mesh for the RAE2822 transonic aerofoil case.
Physics Setup: Configuring the Density-Based Coupled Solver
This transonic aerofoil simulation uses the HELYX density-based coupled solver, which is designed to handle the strong coupling between pressure, velocity, and density characteristic of compressible flows.
The steady-state simulation was configured with the following key settings:
- Flow Model: Compressible.
- Viscosity Model: The Sutherland model was used to account for the temperature-dependent viscosity of air.
- Turbulence Model: The k-ω SST turbulence model with curvature correction was used to model turbulence.
- Boundary Conditions: Atmospheric boundaries were defined as openings. The free stream static pressure was set to 274,500 Pa for the Mach 0.6 case and 228,684 Pa for the Mach 0.78 case. Total temperature was maintained at 115 K for all simulations.
Results Analysis: Comparing Simulation with Wind Tunnel Data
Comparing simulation results with experimental measurements provides a basis for assessing CFD predictions. In this benchmark, the HELYX results show good agreement with the experimental pressure coefficient distributions reported for the pETW wind tunnel campaign.
Pressure Coefficient (Cp) Correlation
The pressure coefficient (Cp) distribution over an aerofoil’s surface is a primary indicator of its aerodynamic performance. The comparison plots below show a good agreement between the pressure coefficient (Cp) values predicted by HELYX and the experimental measurements across the tested flight conditions.
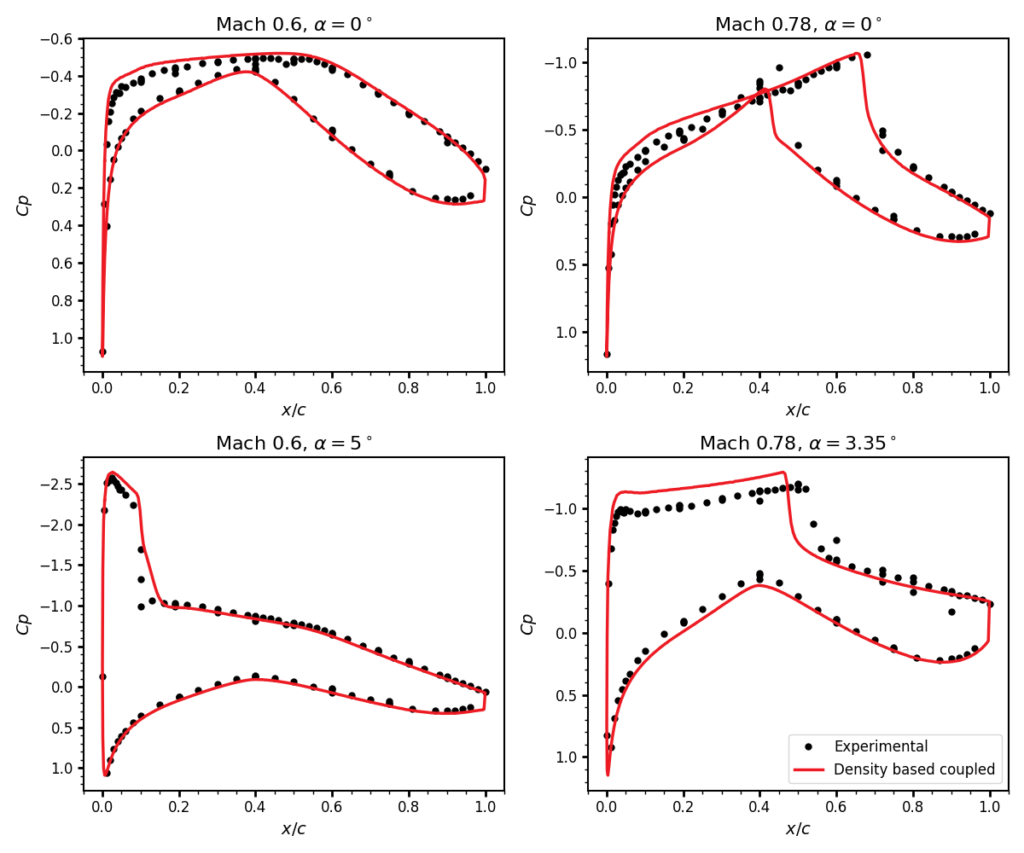
For most cases, the HELYX results align closely with the experimental data points. A discrepancy is observed for the high-Mach-number, high-angle-of-attack case (Mach 0.78, α = 3.35°). Wind-tunnel wall interference effects in the experimental setup may partly explain this discrepancy, as these effects are not represented in the two-dimensional simulation.
A similar approach to CFD validation is presented in our study of the NASA Rotor 67, which compares HELYX simulation results with experimental data for a transonic turbomachinery benchmark.
Shockwave Formation in Transonic Flow
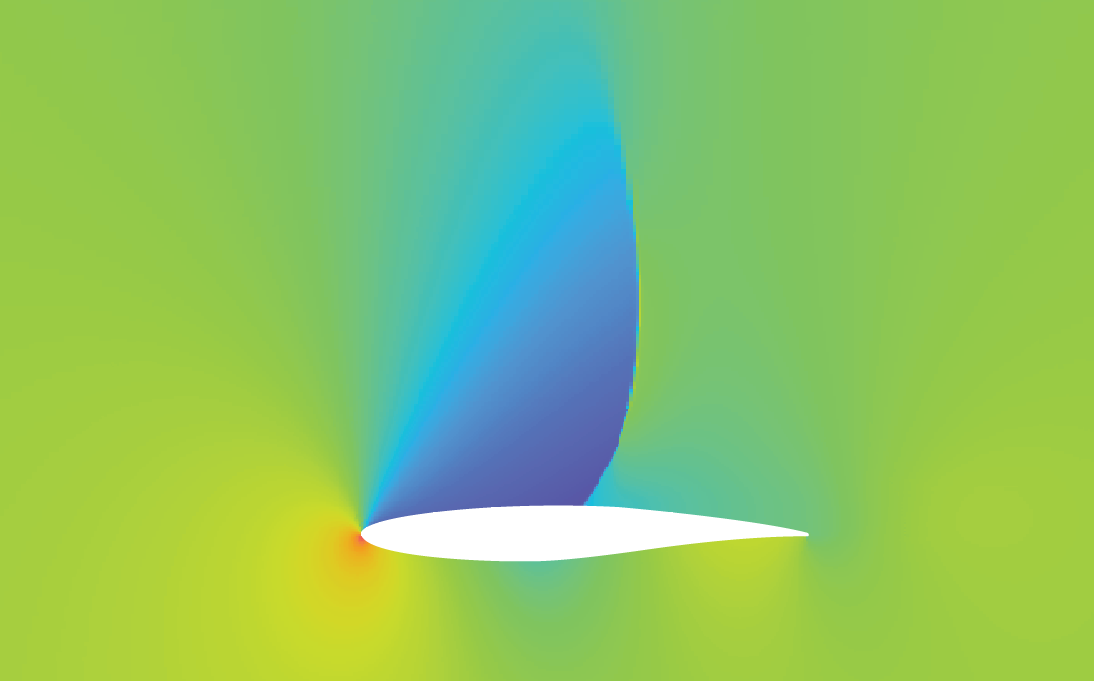
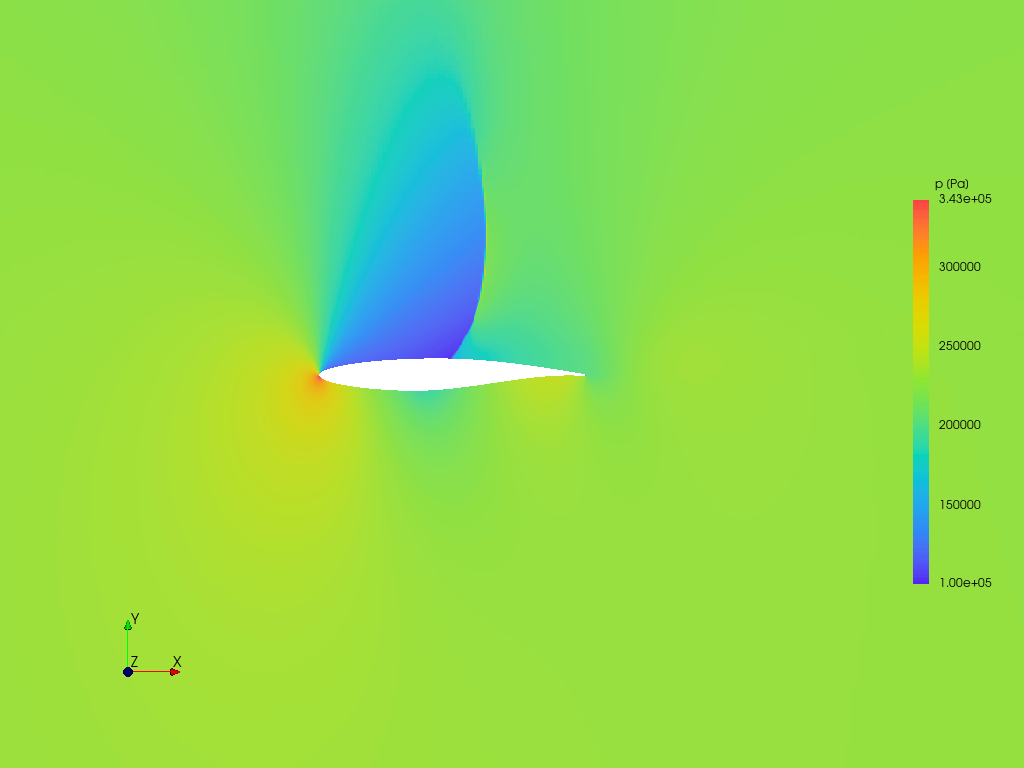
A key challenge in any compressible flow simulation is the prediction of shockwaves. At Mach 0.78 and α = 3.35°, a shockwave forms over the suction (upper) side of the RAE2822 aerofoil. The Cp plot for this case clearly shows a sharp pressure jump, which is the signature of this shock.
The pressure contour plot from the HELYX simulation provides a visual representation of this flow feature. Together with the pressure coefficient distribution, it illustrates the pressure jump associated with shockwave formation on the aerofoil’s suction side at Mach 0.78 and an angle of attack of 3.35°.
Conclusion: HELYX for High-Speed Compressible Flow Simulation
This validation study evaluates HELYX for transonic flow over the RAE2822 aerofoil. The comparison between simulated and experimental pressure coefficient distributions shows good agreement for the investigated conditions, although a discrepancy remains at Mach 0.78 and an angle of attack of 3.35°.
The study documents a meshing approach using helyxHexMesh, with approximately 900k million cells and near-wall resolution of y⁺ ≈ 1, alongside the Sutherland viscosity model and the density-based coupled solver. These details provide a technical reference for engineers assessing the modelling approach used in this aerospace CFD validation case.
The results contribute to the documented evaluation of HELYX for aerospace applications and illustrate the importance of comparing numerical predictions with experimental measurements.

References
- Bouckley, M., White, P., and Bonnefont, J. (2025). Airbus, Pressure Measurements on the Transonic Aerofoil RAE2822. National Wind Tunnel Facility (NWTF). https://www.nwtf.ac.uk/dataset/2687/ ↩︎