The temperature of our cities is rising by 0.5 degC (0.9 degF) per decade [1] with some urban areas experiencing increases of 18% in just four years [2]. Although this may seem inconsequential, recent studies have linked the effects of hotter cities to thousands of premature deaths [3]. This has triggered city councils to implement initiatives that improve the thermal comfort of public outdoor spaces.
Why Are Cities Getting Hotter?
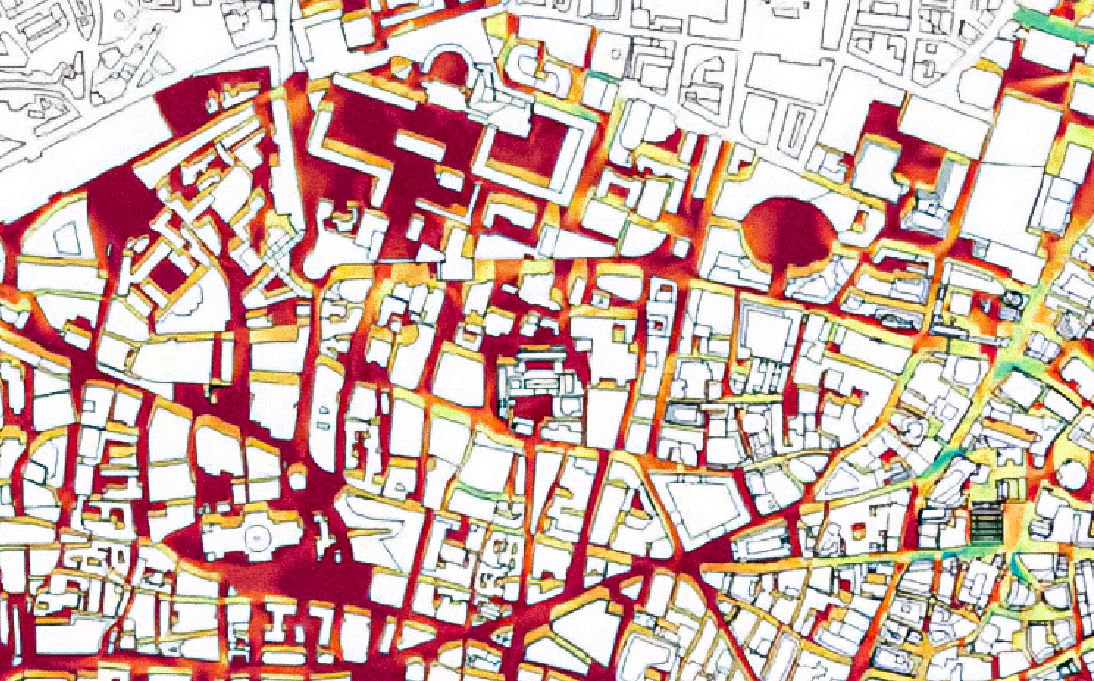
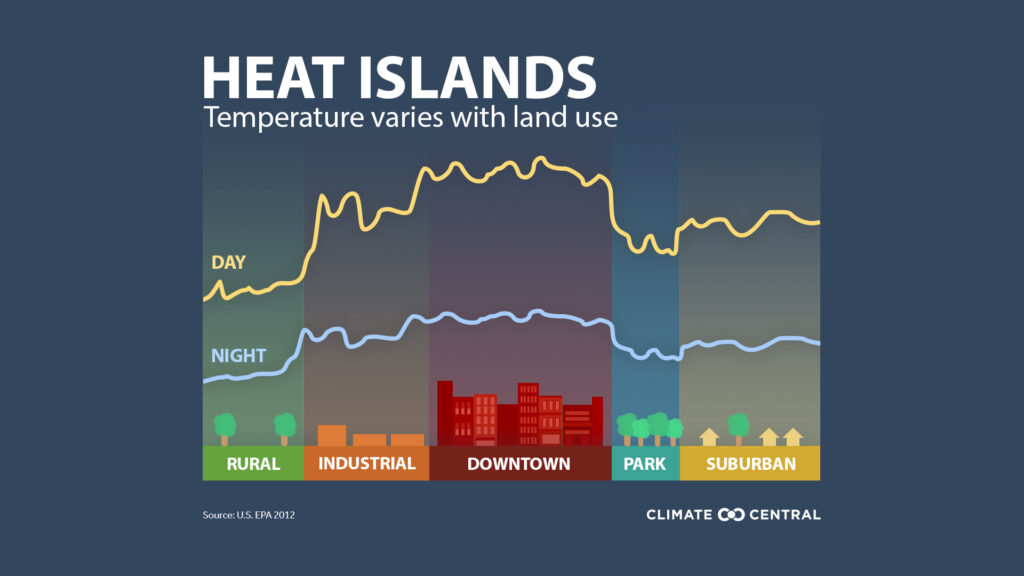
It’s no secret that the planet is warming overall, but increased urbanisation is causing cities to heat up. Average city temperatures are now 29% hotter than surrounding rural areas [1]. This temperature difference between warmer urban spaces and cooler rural regions is referred to as the Urban Heat Island (UHI) effect and results from a multitude of factors.
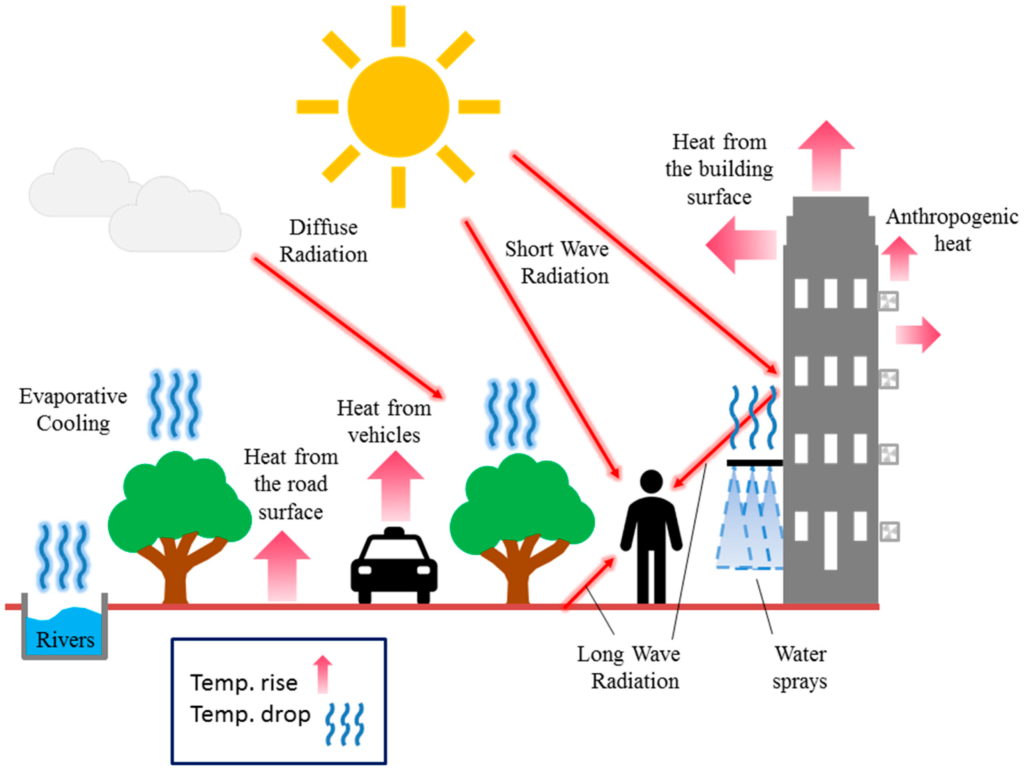
As cities are developed, natural surfaces such as trees and grass are replaced with man-made structures consisting of asphalt, glass and concrete. These materials absorb heat throughout the day and release this heat slowly during the night, increasing the temperature of local surroundings. While human activities including transport, air conditioning and power generation result in wasted energy that is also released as heat. This thermal rise is further compounded by the geometry of cities, with narrow streets and tall buildings leaving little space for heat to dissipate.
The Evolution From Wind Engineering To Thermal Comfort
The increasing severity of this UHI effect has driven a shift in the microclimate movement from focusing solely on urban wind conditions to prioritising overall thermal comfort. In the past, cities used wind tunnels, and more recently CFD simulations along with real-world tests to define acceptable limits of wind speeds for pedestrian comfort and safety. One of the first cities to introduce such limits was Melbourne in Australia back in 1978.
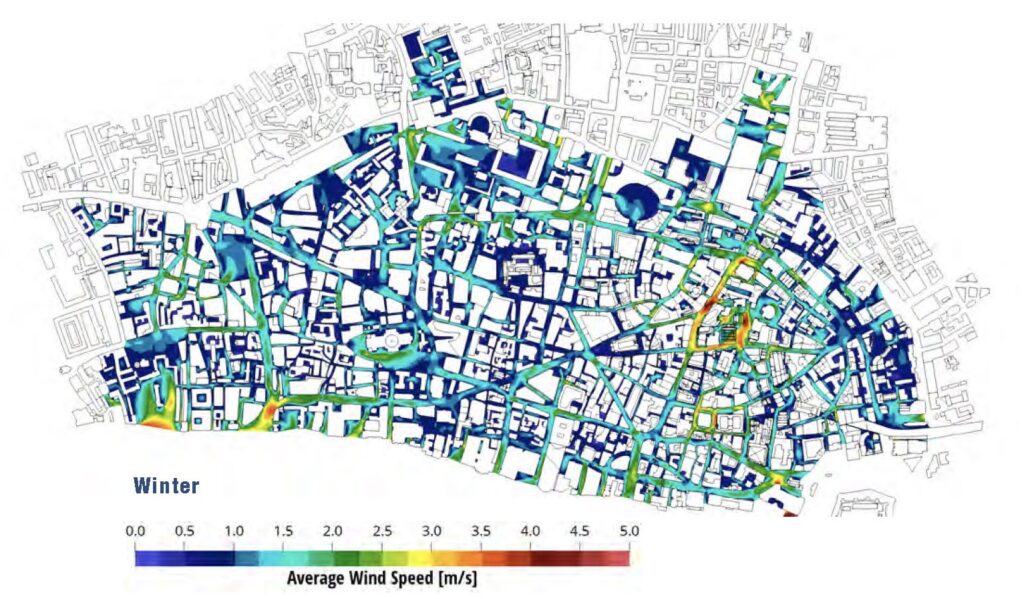
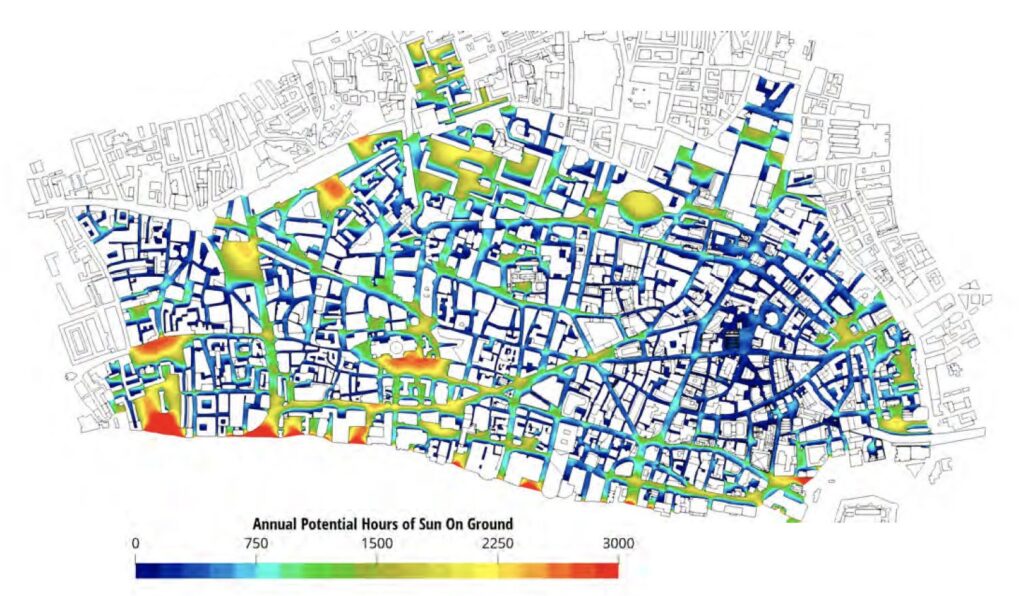
As modelling capabilities improved over the years, more comprehensive regulations could be determined, such as the 2019 London Wind Microclimate Guidelines. These governed how new developments influenced the movement and strength of wind in public spaces [4]. Since then, London has also modelled the amount of sunlight reaching the ground floor which has helped locate outdoor seating areas for maximum comfort, whilst also identifying the need for public roof gardens in dense urban areas.
However, wind and sunlight are just two of the many factors that influence the thermal comfort of humans. Therefore, to truly understand and deliver public spaces with the highest microclimatic quality requires a holistic approach that considers all environmental conditions.
What Is Thermal Comfort?
Thermal comfort is the state of mind where a person experiences satisfaction with the surrounding thermal environment, feeling neither too hot nor too cold. The human perception of thermal comfort depends on environmental factors including air temperature, wind, sunlight, humidity, radiant heat as well as personal factors such as the individual’s metabolic rate, physical activity and clothing insulation.
For example, a sunny open space in winter may appear to be comfortable, but if the air temperature is too low, the humidity is high and there is a strong wind, it will likely feel too cool to be comfortable, even in the sunshine. The physiological response of humans to the external environment can be quantified by the Universal Thermal Comfort Index (UTCI). This is an equivalent temperature index that represents the perceived thermal stress of the human body under given environmental conditions. A high UTCI indicates a human is experiencing thermal discomfort, or is too hot, while a low UTCI signals a human is too cold.
Cooling Cities With Trees And Plants
A powerful tactic to reduce the UHI effect and therefore improve the thermal comfort of public spaces, is through vegetation. Planting trees and shrubs in cities has been proven to have a cooling effect. Some studies show that increasing city tree coverage to 30% can reduce urban temperatures by 0.4 degC [3].
Trees and shrubs not only provide shade from the sun and shelter from the wind, but they also extract heat from the air through a combination of evaporation and transpiration, known as Evapotranspiration (ET). This is essentially the phase change of liquid water into water vapour, which is released into the air through leaves and plant surfaces, decreasing the temperature of the surrounding air.
The Challenges Of Vegetation Modelling
This interaction between vegetation and the environment is a multi-physical phenomenon. Momentum, heat and mass are exchanged between the plants and the air, and these entailed physical complexities require advanced techniques to capture in CFD models.
‘The behaviour of trees and plants is extremely complex,’ explains Salvatore Renda, Engineering Manager at ENGYS. ‘Vegetation is a mitigation tool from an urban planning perspective, it can be used to block airflows, generate momentum resistance and control turbulent flows. It also provides shadowing, absorbs solar radiation, generates humidity and overall reduces the temperature of the local environment.’
‘The complexity comes from the interactions of all these different physics,’ continues Renda. ‘To simplify things, studies typically represent vegetation as a simplified empirical parameterization or are limited to specific interactions such as flow resistance. This means that some physical phenomena are not properly captured, making the cooling potential estimates inaccurate. Whereas we have developed HELYX to include all the physics within a single model.’
The HELYX Approach
When simulation was first used to investigate thermal comfort around 10 years ago, it involved running multiple simulations in different software packages, each dedicated to predicting the behaviour of one environmental factor. The results from all these simulations were then mapped onto a CFD model with a mesh size of a few million cells and further CFD simulations were completed for predominant wind directions.
As the importance of thermal comfort grew, so did the accuracy of modelling techniques and numerical models size. Nowadays, typical meshes are in the order of 100 million cells for large urban areas. CFD simulations are also evolving from steady state RANS towards unsteady and more recently, even LES. LES is already more suited for applications such as wind loading or pollutant dispersion because of its ability to resolve transient and turbulent flow structures more accurately.
‘We have built a set of tools that allow you to capture all the physics effectively in one place,’ highlights Renda. ‘In HELYX, you can run solar calculations and analyse the position of the sun whilst accounting for the cooling effect of vegetation, or the pollution of local traffic.’
‘Our software includes a variety of thermal comfort indexes including UTCI and ASHRAE standard 55, and we continue to improve these as new research is published,’ continues Renda. ‘This ensures our customers are always benefitting from accurate thermal comfort simulation predictions.’
Example Application
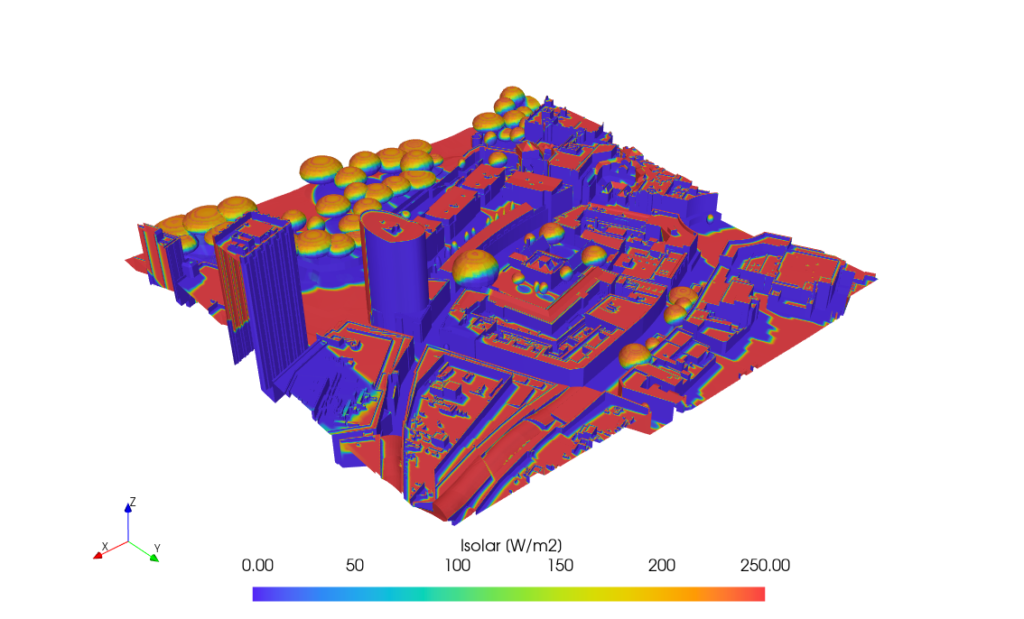
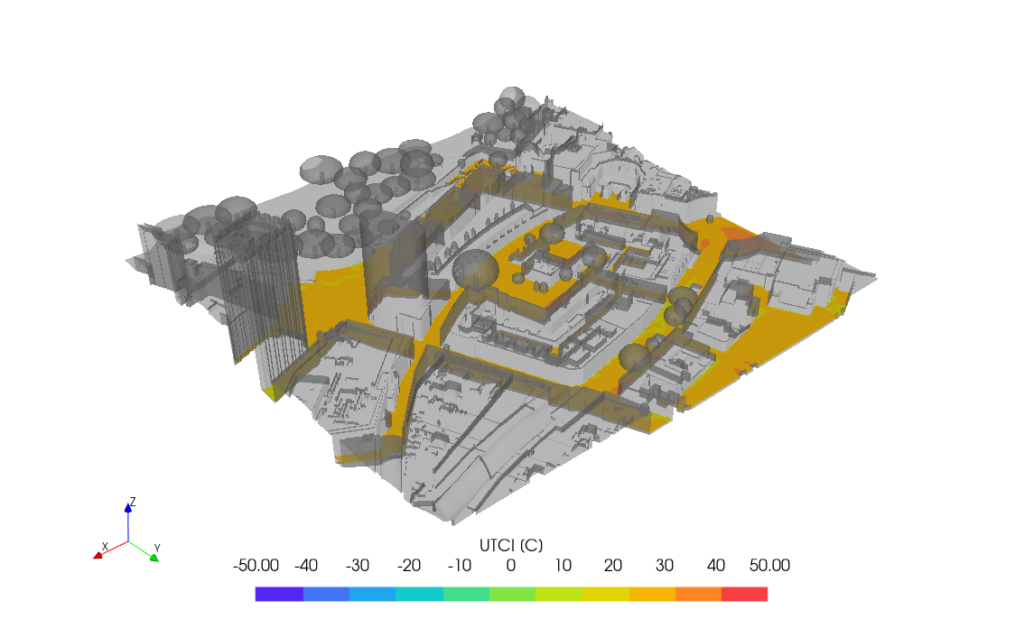
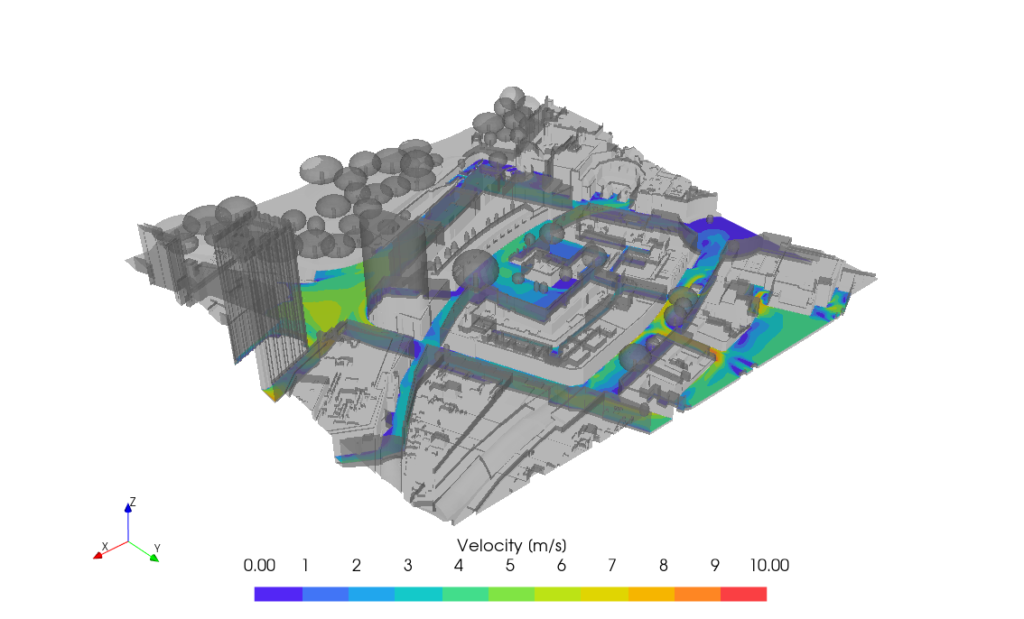
To demonstrate this capability, Renda created a test case which simulated the thermal comfort of a typical UK city. The model includes ABL profiles, temperature and humidity transport, solar and thermal radiation as well as a vegetation model based on a technical paper from the University of Zurich [5]. The mesh, which consisted of 21 million cells, was generated in HELYX in less than two minutes. Computations were performed on 256 cores of the ENGYS HPC Cluster (AMD Genoa 9354) and the simulation took only two hours to run, generating a map of the UTCI thermal comfort index for a single wind direction.
The Ultimate CFD Solution For Urban Cooling
ENGYS’s open-source software not only integrates all the physical phenomena required for precise thermal comfort modelling but also allows companies to scale their simulations efficiently. Consequently, they can run larger, more complex models at much lower costs compared to traditional HPC licenses. While the coupled solver embedded within HELYX accelerates computational time, resulting in faster simulations overall.
‘As thermal comfort has become more of a priority in cities, there has been a surge in CFD, with some companies running simulations with limited experience,’ explains Renda. ‘This has led to many simulations using RANS as it is quicker, but for some applications it risks inaccuracy and unreliable outputs.’
‘We have developed HELYX so that it is easy for anyone to set up and achieve accurate results, whilst also giving the freedom for experts to customise their simulations if they want to,’ continues Renda. ‘We are also working on improving our turbulence models, as well as our coupled solvers and GPU acceleration to shorten the runtime of LES and make it a more viable option for thermal comfort studies for multiple applications in the architectural, engineering and construction industries.
‘Ultimately, urban temperatures will continue to rise, which will have serious effects on mortality,’ concludes Renda. ‘Cities need to quickly and accurately understand the tactics they can use to reduce these temperatures and improve thermal comfort for the public. We at ENGYS are committed to helping urbanists and authorities make more informed and impactful decisions, through cost-effective, reliable CFD solutions and dedicated technical support.’

References
[1] Z.L., W.Z., B.B., J.V., J.L., T.C., Z.W., M.L., F.H., X.L., 2022. Surface warming in global cities is substantially more rapid than in rural background areas[Online]. Nature
[2] Global Temperature Index [Online].
[3] T.L., M.C., F.M., E.P.B., S.K., P.M., 2023. Cooling cities through urban green infrastructure: a health impact assessment of European cities [Online]. The Lancet.
[4] 2019. Wind Microclimate Guidelines for developments in the city of London [Online]. City of London. [5] L.M., T.D., J.A., D.D., J.C., 2017. Transpirative cooling potential of vegetation in urban environment using coupled CFD and leaf energy balance model. ETH Zurich.