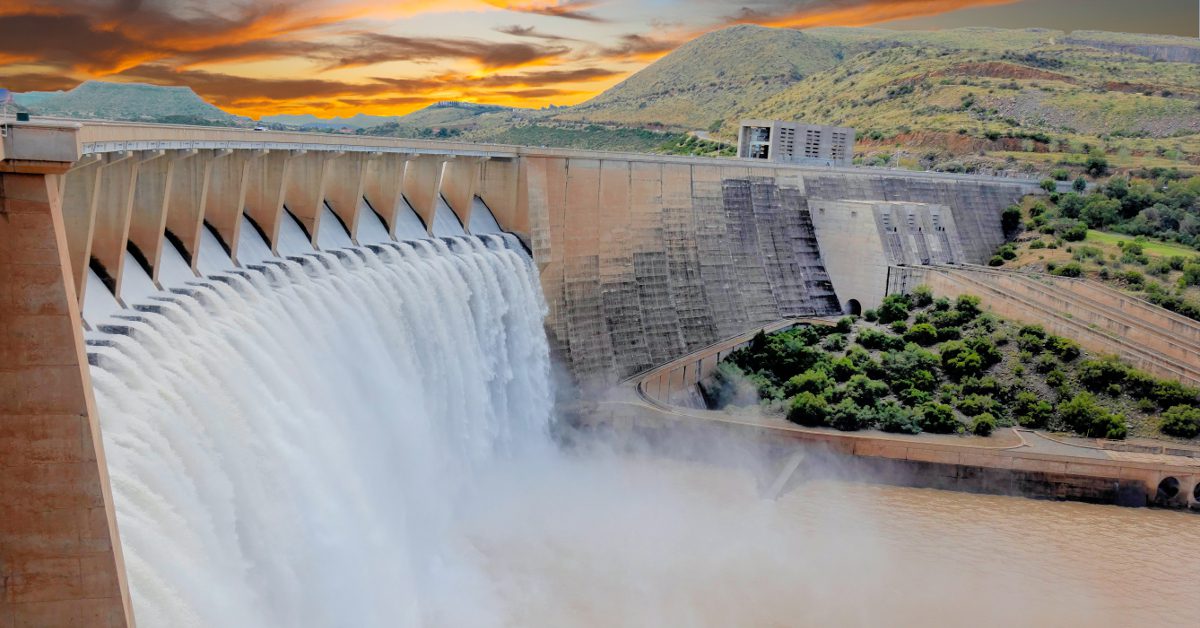
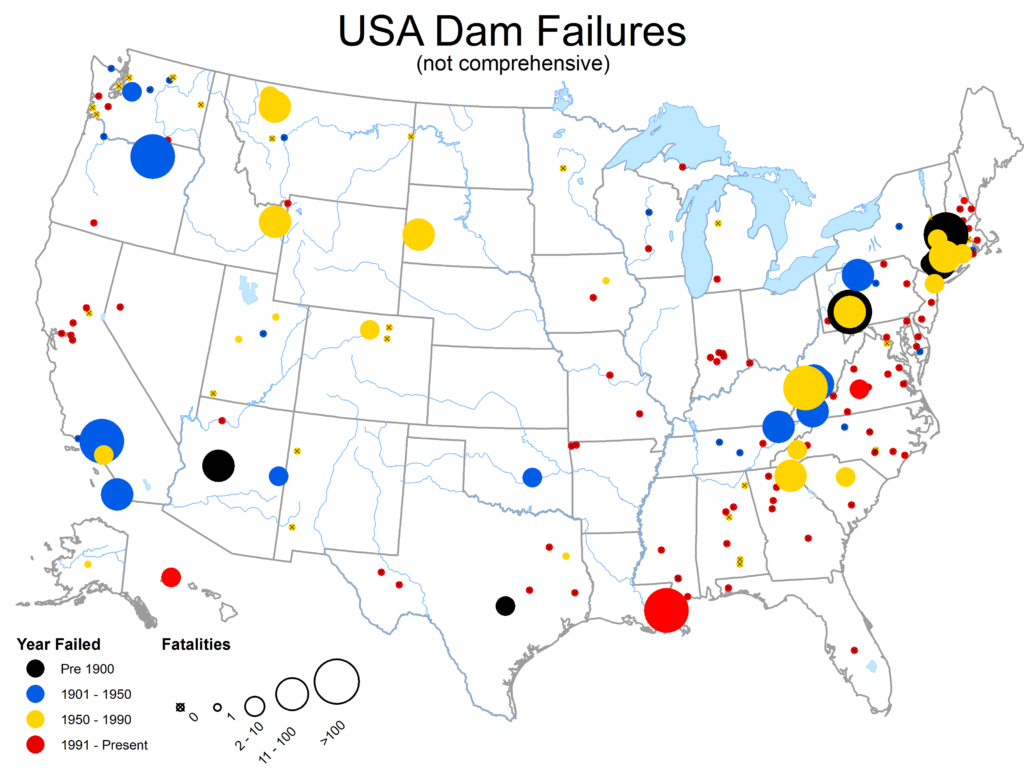
Although the probability of a dam failure is often low, the consequences of one can be catastrophic. In the US, since 1980, there have been on average 24 dam failures per year, with overtopping the most common cause.
Overtopping is where excess river flow causes the water level to spill over the top of the dam. To try and avoid this, spillways are used to provide a controlled release of excess water, managing any overflows. However, these spillways need to be carefully designed to dissipate the water’s kinetic energy effectively, protecting the dam from damage and erosion. In fact, approximately 34% of all dam failures in the United States of America have been caused by insufficient spillway design.
Dam Safety Regulations
To ensure the safety of dams, these concrete structures have to comply with a detailed set of regulations, which includes an assessment of the dams Acceptable Flood Capacity (AFC). This essentially determines the capacity of a particular dam design to handle flooding.
The regulations along with the AFC are specific to each dam and depend on the potential consequences of a failure for that particular area. As a general rule, dam failures that can cause excessive damage or loss of life need to be designed to much higher standards than dam failures with less severe consequences.
However, as the local hydrology changes over time and our predictions of flooding become more accurate, the regulations along with the AFC need to be constantly updated. One existing dam that required reassessing was the Rifle Creek dam, located near Mount Isa in Queensland, Australia. Built in 1929, this dam is 18m high, has a total curve length of 125m and can store up to 9,500 mega liters of water. Its flood waters are currently discharged through an uncontrolled ogee overflow spillway in the centre of the dam.
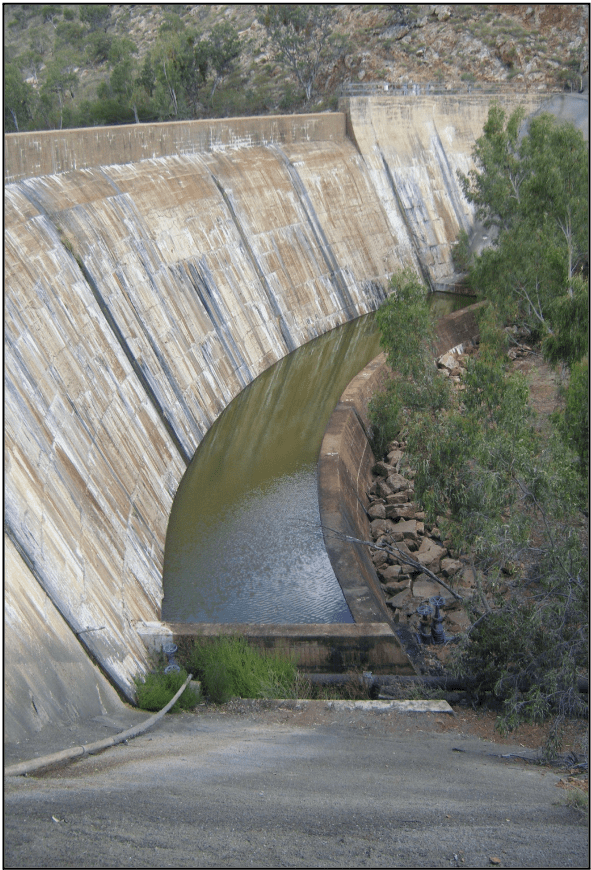
An updated AFC was carried out on Rifle Creek and it was found that the capacity of the current spillway was less than 25% required by the AFC. The owners of Rifle Creek turned to AECOM, who were tasked with finding a suitable low cost solution for upgrading the dam to pass more water over the spillway safely.
‘The problem was that the unique shape of Rifle Creek meant that the spillway was neither a flip bucket or roller bucket dam,’ says Franz Jacobsen, an engineering consultant formally at AECOM and currently Manager of ENGYS’ operations in Australia. ‘The configuration of the dissipator falls outside the guidelines of a flip bucket, because the trailing edge angle is too high and the roller bucket configuration requires higher tail-water than exists in Rifle Creek. So, I decided to use CFD to try and determine how the dam behaved and then we could analyse it’s safety.’
CFD Model
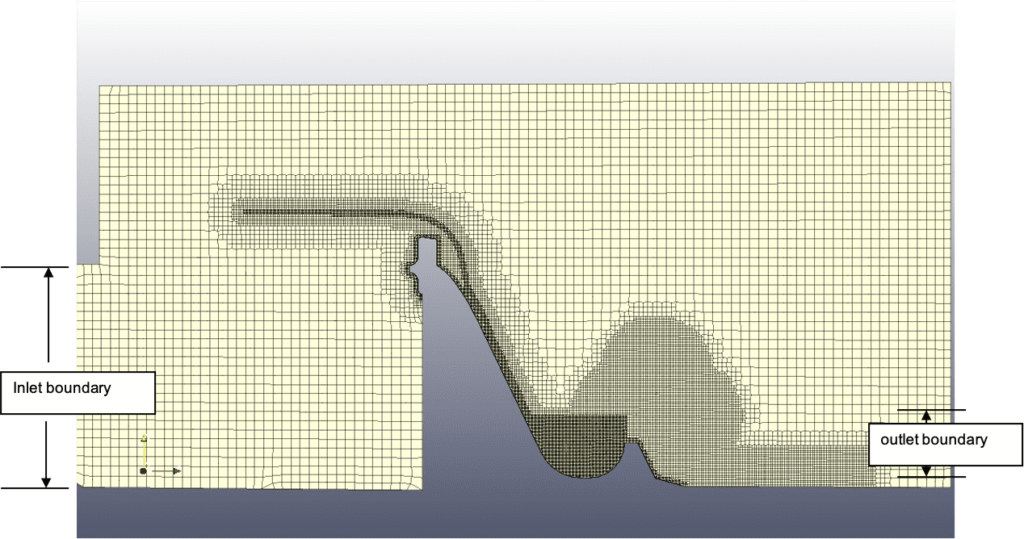
A CFD model was developed using HELYX software from ENGYS to try and understand the height and extent of excess flow as it is ejected over the spillway. Previous spillway studies showed that the HELYX solver predicted spillway flow to within 2% error of physical results.
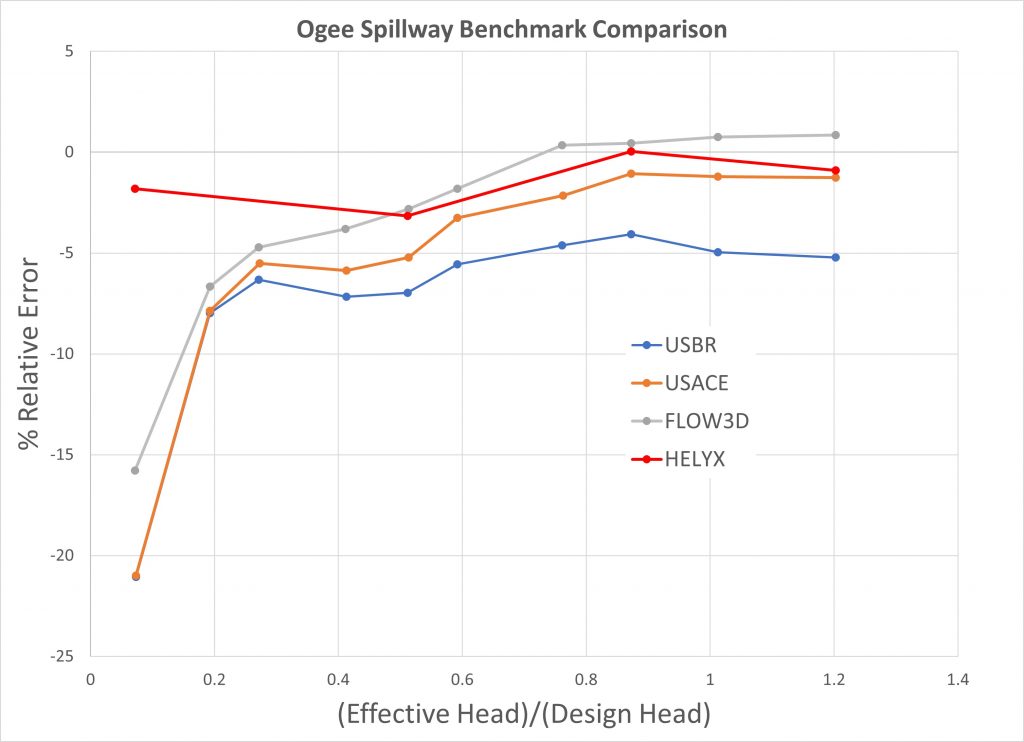
‘Customers choose HELYX because of its high accuracy and also low cost. It doesn’t have the high license fees of other software solutions,’ says Jacobsen. ‘For this project, we were able to quickly set up and perform a simulation of the spillway to understand it’s flow characteristics.’
Due to the large curvature of the dam, it was assumed that the case was dominated by in-plane flows . This meant that the CFD model could be simplified to 2D and was based on a section through the centreline of the dam. With the 2D profile ready, a mesh consisting of 650,000 cells was created and then refined in important areas such as the flow layer and spillway.
RANS vs LES
Once the mesh was completed, simulations were run using two different turbulence solvers; RANS (Reynolds Averaged Navier-Stokes) and LES (Large Eddy Simulation). ‘I used two types of turbulence modelling as a sanity check and the results were very different between the two,’ says Jacobsen.
‘The results from the RANS simulation didn’t look right and after some research I found that RANS modelling seems to struggle with complex flows and flow separation. But before committing to the LES results, I wanted to validate them and that’s what triggered me to develop a scale physical model.’

Physical Model
Building a representative physical model of a dam comes with a whole host of challenges. Not only does the geometric scale of the structure need to be accurate, but also the kinematic similarity of the water flow. Reynolds number was used to determine the geometric scale, while the Froude number was used for flow scale similarity. After some investigation, a Reynolds number of >5e5, which is in the turbulent flow regime, was chosen for a geometric scale ratio of 1:50.
‘At first I tried using a garden hose but this was nowhere near the flow rate I needed so I ended up using a construction pump,’ reveals Jacobsen. ‘The next challenge was achieving a uniform flow over the model spillway because it was really turbulent so I used an arrangement of bricks and other materials to dissipate the flow.’
For a final comparison, the initial 2D CFD model was converted into 3D, with the same scale, width and inlet boundary conditions as the physical prototype. After analysing many photographs and videos, the observed flow patterns of the physical model matched those shown in the LES simulations. Both generated the same average plume height, length and flow characteristics.
Results
The HELYX CFD results showed that with low flood levels at around 25% of the AFC, a hydraulic roller formed at the toe of the spillway. This effect can lead to soil erosion adjacent to the flip bucket and was validated by rock protection already in place. As a further protective measure identified from this study, the erosion protection was extended to a total of 10m from the spillway.
In higher flows, the CFD results highlighted that the spillway directs flow away from the dam in a trajectory typical of a flip bucket design. This further confirmed the spillway and methods of erosion protection were suitable for a range of flood events varying from rare to extreme.
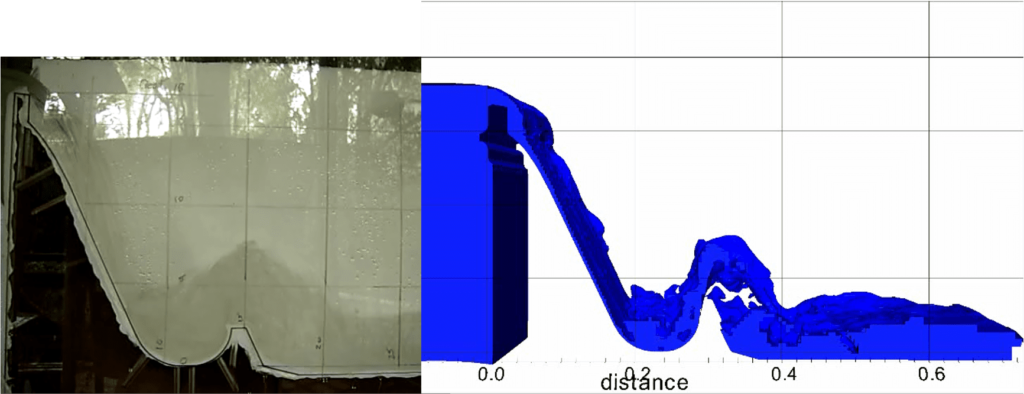
‘From these results we could demonstrate to regulators that the spillway was like a flip bucket and because we had verified this with a physical model we could have confidence in these results,’ highlights Jacobsen. ‘We were able to show that the erosion downstream wasn’t a problem for higher flows and could also quantify the rating curve of the amount of flow going over the dam, just through numerical analysis.’
Through the assessment of this report, regulators subsequently declared the dam safe, it was proven to meet the AFC criteria and no further work was needed. ‘We could prove the dam was safe and that it could pass a larger flood even though it was being overtopped,’ says Jacobsen. ‘This not only meant that the dam could be kept in operation but it didn’t require upgrading; saving the dam owners money,’ continues Jacobsen.
‘The great thing about using HELYX for this study was that we could try any idea, refine and run it again. As there’s no limit on the number of CPU’s you can use or how long you can use them for you can run through as many iterations as you want without worrying about CPU time.’

