Why do you have to yawn or swallow to equalize the pressure in your ears when travelling through a tunnel? It’s all to do with a phenomena called the piston effect.
What is the piston effect?
When a train enters a tunnel, it compresses the air ahead of it, as the air it displaces is confined by the tunnel walls. This generates a compression wave which propagates through the tunnel at the speed of sound.
At the tunnel exit, the majority of this pressure wave is reflected back, leading to pressure fluctuations within the tunnel. These sudden pressure changes can cause aural discomfort for passengers as the pressure imbalance between the inner and outer ear exerts a force on the eardrum. This is why you have to yawn or swallow to equalize the pressure across your eardrum. The ‘pop’ you hear is your eardrum returning to its original position.
The rest of the compression wave is radiated out of the tunnel, resulting in a pressure pulse which causes a loud tunnel boom. This can damage trains as well as disturb nearby structures and residents. Tunnel boom is particularly noticeable in trains due to their large cross-sectional area and minimal clearance with the tunnel walls. In the case of the 1989 Japanese bullet train, this tunnel boom could be heard up to 400m away.
This behaviour of air in a tunnel is similar to a mechanical piston moving in a tube, hence the name ‘piston effect’. It is a phenomena that occurs across many industries, causing issues in elevator shafts, drainage pipes and underground stations.
Simulating the piston effect
The precise characteristics of the piston effect depends on a variety of factors. These include the speed of the object, its cross-sectional area as well as the shape and design of the tunnel. To fully understand the influence of these variables on the aerodynamics within a tunnel, engineers are turning to Computational Fluid Dynamics (CFD). ENGYS was asked by Tecnosistem S.p.A to conduct a comprehensive CFD analysis of a train moving through a tunnel using HELYX. They wanted to monitor the pressure and mass flow rate at specific locations to evaluate the effect of the pressure pulses on the safety of passengers.
Generating a mesh
The 2D geometry of the train and tunnel cross section were provided. ANSYS SpaceClaim was then used to generate the 3D geometry which was easily imported into HELYX via the ANSYS SpaceClaim plugin.

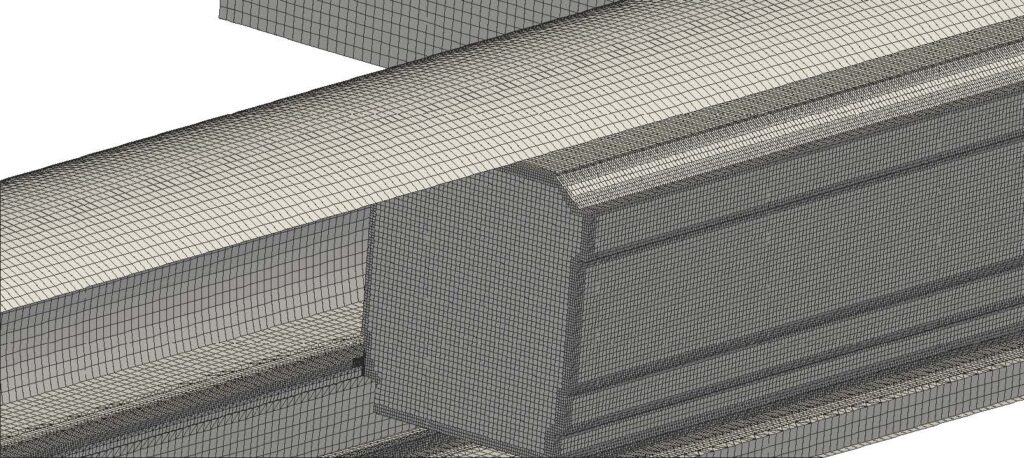
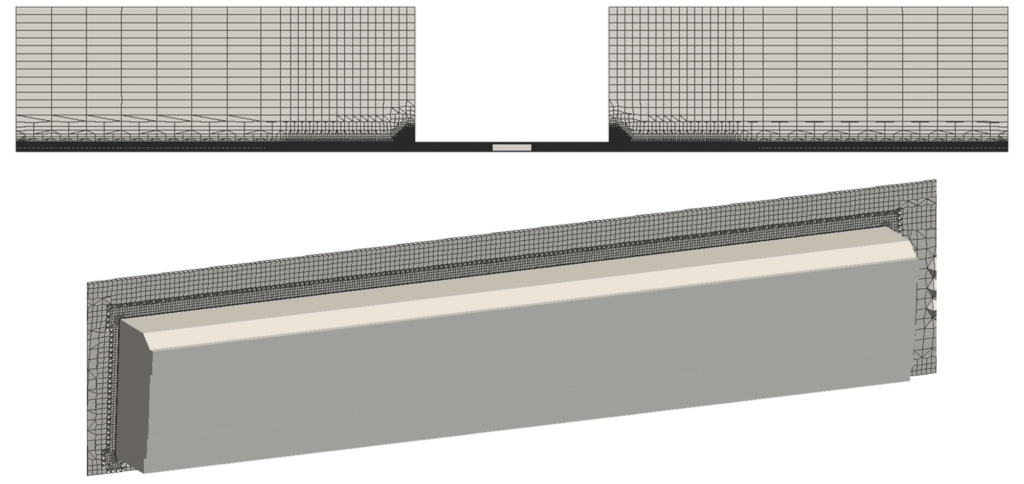
To gain a full understanding of the behaviour of the pressure waves, an advanced moving mesh algorithm, developed by ENGYS, was used. This models the relative motion between a slider (representing the train) moving through a mesh block (representing the static tunnel). Therefore, not only did the surface of the train and tunnel both require meshing, but also the internal and external volumes of the tunnel.
‘The main challenge here was creating an accurate but efficient mesh,’ highlights Paolo Geremia, Director at ENGYS Italy. ‘Inside the tunnel the proximity between the train and the platform meant we had to utilize very fine cells. We also tried to maintain the same mesh density throughout the surface mesh of the train. This was to avoid any resolution issues when simulating transient pressure behaviour.’

‘To try and minimize cell count, we then used a mesh stretching algorithm for the far field outside the tunnel. This sparser mesh used high aspect ratio elements which reduced computational time.’ Unlike other software, the helyxHexMesh mesher created both the surface and volume meshes in one automated process. The final mesh consisted of over 7 million cells, which the mesher generated in around 10 minutes.
Results
Once meshing was completed, a transient RANS simulation was run. This used a segregated compressible flow solver with the kw-SST turbulence model. The result was a 15s simulation which solved in 8.1 hours on a 48 core computer.
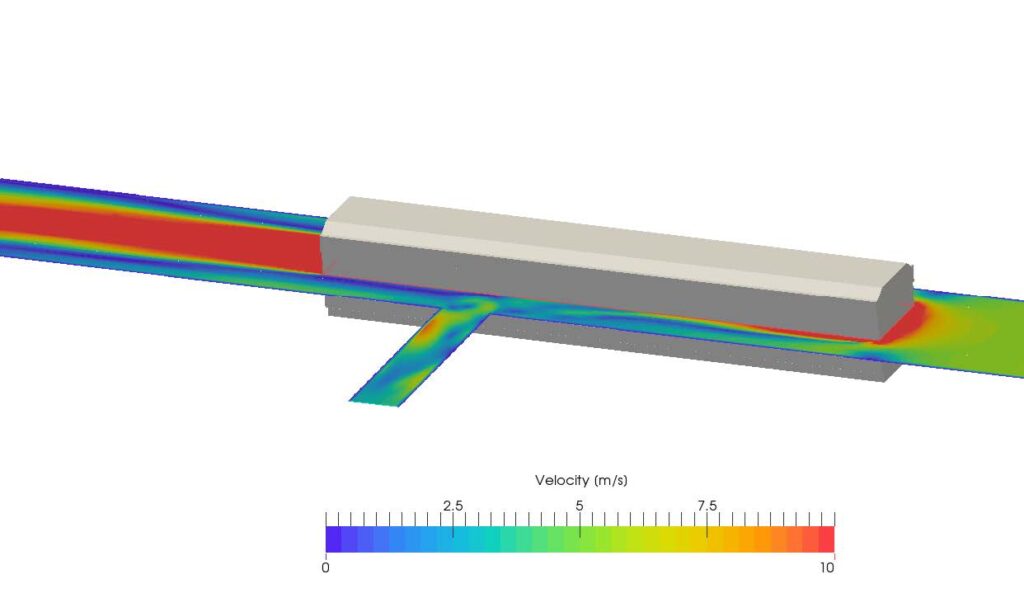
The animation above shows how the pressure waves fluctuate as the train moves through the tunnel. The client wanted to monitor the resulting pressure forces and mass flow rate at three specific locations:
- Bypass outlet section
- A door in the tunnel 4m downstream of the bypass section
- A platform 8m downstream of the bypass section

Accurate analysis of the pressure and mass flow rate were key for the client to ensure the safety of passengers. While the surface pressure data for the tunnel door was exported to Nastran. This allowed the client to conduct FEA simulations to assess the structural integrity of the door using the simulated pressure measurements.
‘In this case the client didn’t have any experimental data to compare to. However, our results did match other commercial software, proving the accuracy and reliability of HELYX,’ concludes Geremia. ‘This project had to meet a whole host of different criteria whilst modelling a variety of elements. But the simultaneous approach of HELYX helped to achieve this complex multi-faceted analysis in one single simulation.’


